 ';
include("head.php");
?>
';
include("head.php");
?>
John H. Vanston, Ph.D.
Technology Futures, Inc.
PDF (printable) version
All planning is, by definition, oriented in the future. No one makes dinner plans for last week. No successful person is truly interested in the present, except with regard to how it can be changed in the future. Thus, all business plans, all financial plans, and all marketing plans are based on projections about how the future will unfold. These projections--forecasts--can be formal or informal, implicit or explicit, short term or long term. However, regardless of the type of forecast used in business planning and management, the success of the plan will, in large measure, depend on the validity of the forecast.
Decision makers must--and do--trust their careers to forecasts about the future of technology, market tastes, the economy, the business environment, laws and regulations, and a myriad of other factors. Quite naturally, these decision makers are vitally concerned about the soundness and validity of the forecasts.
Because of the importance of valid forecasts and because the people charged with making key business decisions typically rely, to a great extent, on forecasts made by others, it is essential that planners, executives, and other decision makers be able to assess the validity of various forecasts. In making such assessments, these people typically rely on the reputation of the forecaster, the results of past forecasts, or their personal comfort with the forecast. However, in many cases, a more formal assessment of a forecast can be of significant value to people who must stake their reputations and careers on its validity. The purpose of this paper is to provide a set of tools that can assist in making such an assessment.
Studies of failed forecasts indicate that there are two primary reasons for such failures: the use of inappropriate or outdated information and the use of improper models. It appears reasonable, therefore, to utilize procedures that will test each of these factors.
There are two general types of data typically used in forecasting: statistical data and expert opinion. Tests for the two types of data are similar, but do have significant differences.
Statistical Data
Statistical data should be examined for the following qualities:
Reliability of Source. Obviously, data sources with long reputations for reliability and accuracy are more credible than those without such reputations. Data from official government agencies usually have strong credence, as do data from recognized authoritative sources such as professional associations, public service organizations, and media files. For example, the Census Bureau projection of school age population (shown in Exhibit 1) appears to be quite reliable, both because the organization has a long history of accurate population projections and because most of the people reflected in the projection have already been born.
In similar manner, the data sources listed in Exhibit 2 appear to be quite credible, and they represent a variety of very different types of inputs. On the other hand, the sources listed in Exhibit 3 raise serious reliability questions, both with regard to the sources and treatment of the data.
There are a number of commercial organizations that provide data for a fee. These vary from those that organize and publish data in a general subject area to those that provide data in very narrow and specialized areas. The reliance that can be placed on this information depends on the reputation of the organization, its past record, and the credibility of the organization's own information sources.
Exhibit 1Projections of U.S. School-Age Population |
||||
| 2000 | 2005 | 2010 | 2025 | |
| Under Age 5 | 19* | 18 | 20 | 22 |
| 5-13 | 36 | 36 | 36 | 40 |
| 14-17 | 16 | 17 | 17 | 18 |
| 18-24 | 26 | 28 | 30 | 30 |
| Total (all ages) | 275 | 286 | 298 | 335 |
| * In Thousands | ||||
Source: U.S. Bureau of the Census (1996)1
E-mail and Internet web sites offer a wealth of data to people acquainted with their use. Although there are means of checking the accuracy of such data to some extent, in general, data obtained from such sources should be viewed with considerable trepidation. Of course, the most serious questions about reliability arise when the sources of data are not indicated at all.
Exhibit 2Sample Data Sources, Flat Panel Displays |
|
| Data Source | Why This Is a Good Source |
| Nikkei Microdevices Flat Panel Yearbook, 1996 | This was written in Japanese for the Japanese market. The U.S. government paid for the translation, which is sold to the American public for $900 per copy. This source was used in the data table for time series one through six. |
| Company confidential report, Hewlett-Packard Company | This report was written by an HP engineer for their internal consumption. HP, as a computer manufacturer, is vitally interested in the flat panel market and continuously monitors its developments. HP has made investments in the industry including at least one start-up company developing an alternative technology (field emission displays) to the current technology of choice, active matrix liquid crystal displays. This document is an original source for some of the included data and a secondary source of data that was obtained by the HP author and through literature sources, all of which are Japanese. |
| Flat Information Displays, Stanford Resources, Inc. | Referred to in the October progress report, this report was written by a market research organization. This document was obtained at a cost of $2,500 by the Department of Defense and is only available for purchase. |
| Department of Defense Advanced Research Projects Agency (DARPA) | DARPA provided some extracted data from relevant internal documents. This data was provided after a search of the DARPA files for pertinent information. |
Source: Dr. R. S. Goodrich2
Data Source Reliability
| In order to produce technology trends, data were collected from several magazine sources. Unfortunately much of the data came from vendor advertisements, making it vulnerable to "enhancements" by the manufacturers. However, if everybody cheated in the same way by about the same percentage (a very reasonable assumption), then the overall trends should not be affected too much. |
Source: Dr. R. S. Goodrich3
Currency. Because the gathering of primary source data is both difficult and expensive, forecasters often extrapolate from old information or, for convenience, continue to use information that has grown long-of-tooth. Moreover, many fore-casters utilize data available from other agencies without giving due regard to the timeliness of the data. This shortcoming can be particularly serious in areas in which technologies, business practices and/or alliances, and market realities change rapidly.
In examining data for currency, it is usually desirable to determine if all of the data is historically based or if a portion is projected data. Obviously, projected figures are normally not as reliable as historical data. However, our experience has indicated that information based on announced company plans is usually reasonably dependable.
Potential Bias. Even information that is factually accurate can be misrepresented by improper emphasis, selected omission, or prejudicial organization. Such misrepresentation may result from the bias of the agency providing the information,and may be deliberate or unconscious.
Certain biases may be suspected from the nature of the supplying organization. It would not be surprising that the American Gas Association and the Edison Electric Institute presented different pictures founded on the same basic information. Forecast data input should always be examined for natural bias.
Unconscious bias is more difficult to uncover because it is normally unintended and non-obvious. Often, examination of word choices, stock phrases, or unusual organization of data can be a tip-off to unmindful bias.
Gathering Technique. Often the technique employed in gathering the data can skew the validity of it. For example, one technique for projecting the nature and rate of change is called Content Analysis. In this method, records are kept of the amount of media attention devoted to emerging issues. As the number of column inches devoted to an issue increases, it is assumed that its importance and probability increases. The potential value of this approach has been well documented. However, one of the practitioners of this technique reveals that his organization does not include newspapers or magazines from any large American city, because of the belief that only small cities and rural areas truly represent American society. Obviously, the data from this source would be considerably different from data based on the belief that opinions and ideas from cities such as New York, Los Angeles, and Chicago are of some importance in defining the nature of our society.
Relevancy. Because of the difficulty in obtaining and organizing data, organizations often maintain records of information that is easy to determine rather than relevant to the decision-making process. It is much like the old story of the man who looked for a lost coin in the place where the light was best, rather than in the place where the coin had actually been lost. In assessing statistical data, one must consider if the data being offered is truly relevant to what is being forecast. A simple test is to remove the information from the forecast and determine if the forecast is materially affected, either in its conclusions or the degree of support for the conclusion.
Expert Opinion Data
When statistical data is unavailable, of doubtful quality, or of questionable relevance, forecasters often turn to data based on the reasoned opinions of experts in the field. Although such data is often believed to be inferior to statistical data, in many cases this isn't true. In fact, expert opinion is often used to support or counter statistical data. However, information garnered from experts in a given field must also be tested for reliability and significance.
Qualifications of Experts. By definition, the term "expert opinion" requires that the sources of information have qualifications in the area in which they are providing input. In expert opinion activities, one typically does not include the village wino. In evaluating the forecast, one should give careful consideration to who provided input to the forecast and to the expertise they bring to the process. The case study on the following page provides a good example of how forecasters can validate the qualifications of their expert opinion panels.
Bias. We are all prisoners of our own pasts. Therefore, our observations and opinions are colored by our experiences, education, and expectations. As with statistical data, these biases may be recognized and acknowledged or may be unconscious and denied. In either case, forecast assessors must be alert for such biases and be prepared to give them proper account.
Balance. Given the fact that each person providing expert opinion input has, at least to some extent, personal biases, forecast assessors should examine whether or not the panel of experts represents a divergence of profession, experience, back-ground, and position. No expert panel can ever include every possible viewpoint; however, assessors should, at a minimum, determine if the panel is so out of balance as to cause doubts about the validity of the forecast.
The second major cause of invalid forecasts is the use of inappropriate models in projecting how the future will evolve. In this instance, the term "model" is used to mean how the forecaster treats the myriad of factors that will determine the future, as well as the interactions between those factors. One means for testing whether or not an appropriate model has been used is to examine the forecast in terms of a number of models.
The case study, in my mind, represents an excellent example of how an expert opinion panel should be validated. The forecaster lists the people interviewed by name, together with their qualifications in the area being forecast. Moreover, the qualifications of the panel appear to be quite high, and any potential bias is reflected by their professional affiliations. In this case, note that the forecaster did not attribute specific input to a particular expert, thus maintaining appropriate anonymity.
A small group of people from across the country that are all experts in flat panel dis-plays agreed to support this study by responding to a Delphi survey. Seven experts agreed to participate, and this study includes responses from the six that were received. This group includes, arguably, some of the most knowledgeable people in the country on flat panel displays. Four of the five were responsible for determining the technical direction of the national high-definition systems agenda through their management of the Defense Advanced Research Projects Agency's High Definition Systems research program. Mike Kelly came to DARPA based on his experience with IBM to organize and be the first manager of the Defense Manufacturing Office. Marko Slusarczuk was the first program manager for display research at DARPA and is responsible for supporting major technology breakthroughs done by such companies as Texas Instruments and was instrumental in the start-up of at least one company. Dave Slobodin and Mark Hartney both left DARPA in the past year, having each been responsible for managing the only continuing major research program in flat panel displays.
These four individuals have had a very strong hand in, and deserve a lot of the credit for, the efforts to create a U.S. flat panel industry. Many promising U.S. companies would not be in existence today, nor would they have been able to find the resources for their flat panel technology without the guidance and support of these four.
The fifth confirmed person came from the technical ranks of AT&T to become the chief technical officer of the U.S. Display Consortium which is the only organization representing the U.S. national flat panel interests. USDC manages the principle government/industry cooperative research program with the Koreans. Bob Pinnel, as the CTO, is in a unique position to under-stand both the U.S. and foreign flat panel display activities and trends.
The other two participants are long-time private sector leaders in flat panel displays. Dr. Webster Howard spent 20 years with IBM as an expert in flat panels and was instrumental in negotiating the joint venture with Toshiba to supply the IBM notebook computer screens. He is currently the senior technologist with a new alternative technology company, FED Corporation, and is the current president of the Society for Information Displays. Dr. Roger Johnson, a former faculty member of the University of Illinois, is Senior Vice President of SAIC, a diversified technical services and manufacturing concern with over $2 billion in revenues. He actually builds and integrates flat panel into more complex systems. He acquires panels from overseas and domestically, as well as builds them himself and integrates them into such products as ruggedized field use computers.
Source: Dr. R. S. Goodrich4
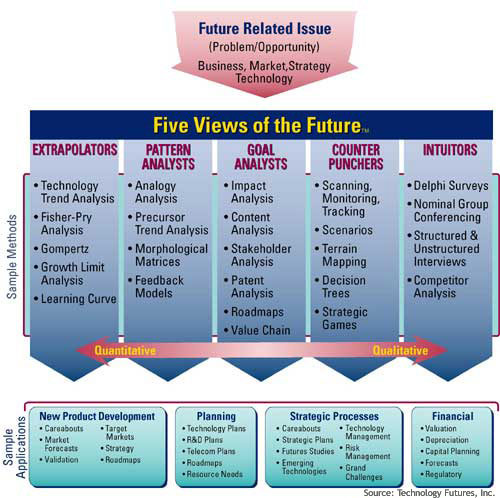
Five Views of the Future™, A Strategic Analysis Framework
Source: Technology Futures, Inc.
In our work, we have found it useful to examine five different models that we have developed in our forecasting activities (see Exhibit 4). These models are as follows:
Extrapolators believe that the future will represent a logical extension of the past. Large-scale, inexorable forces will drive the future in a continuous, reasonably predictable manner, and one can, therefore, best forecast the future by identifying past trends and extrapolating them in a reasoned, logical manner.
Pattern Analysts believe that the future will reflect a replication of past events. Powerful feedback mechanisms in our society, together with basic human drives, will cause future trends and events to occur in identifiable cycles and predictable patterns. Thus, one can best address the future by identifying and analyzing analogous situations from the past.
Goal Analysts believe that the future will be determined by the beliefs and actions of certain individuals, organizations, and institutions. The future, therefore, is susceptible to modification and change by these entities. Thus, the future can best be projected by:
Counter Punchers believe that the future will result from a series of events and actions that are essentially unpredictable and, to a large extent, random. Therefore, one can best deal with the future by:
Intuitors are convinced that the future will be shaped by a complex mixture of inexorable trends, random events, and the actions of key individuals and institutions. Because of this complexity, there is no rational technique that can be used to forecast the future. Thus, the best method for projecting future trends and events is to gather as much information as possible and, then, to depend on subconscious information processing and personal intuition to provide useful insights.
Obviously, each of these views has its attributes and its shortcomings. Extrapolators utilize self evident logic and take advantage of the fact that most often the future is founded on the past. However, this view does not take into account that changes in driving forces can result in rapid and dramatic changes in trends.
Pattern analysts take note of the fact that, often, history does repeat itself. The adoption of color television closely followed that of black-and-white television which, in turn, followed the pattern of radio adoption. On the other hand, it is quite possible to choose an invalid analogy and, in any case, analogies are never exact.
Goal analysts take cognizance of the fact that technical and non-technical advances do not take place in a vacuum and understand the impact of strongly held beliefs and opinion in "real world" situations. However, it is often difficult to assess the dedication and potency of the various stakeholders involved in a given situation.
Counter punchers give credence to the complex, interactive nature of our society and the fact that the results of events and decisions are often quite different from those intended or expected. A counter puncher mentality, however, may minimize the value of planning based on best judgments about how the future will evolve.
Intuitors take advantage of the marvelous, not-well-understood capability of our brains to integrate vast amounts of information and varied experiences into a whole. Experiments have shown that certain individuals, typically successful executives, have better intuition than most others. However, excessive dependence on intuition may result in a failure to pay appropriate attention to known information.
The challenge is not to determine which of these views is the "right one" or even the "best one." The challenge is how to use Five Views of the Future™ Stratetic Analysis Framework to judge the validity of the forecast being assessed. In using this framework, the person doing the assessment applies the type of test that people using each of the views might employ.
For example, an extrapolator would probably ask the following questions:
A pattern analyst might assess the forecast by:
A goal analyst might test the forecast by asking the following questions:
A counter puncher would probably test the forecast by asking the following questions:
An intuitor's analysis might address the following issues:
Because of the importance of valid forecasts in effective planning and its execution, it can be very useful for decision makers to have a systematic approach for assessing the forecasts of others. This paper outlines a framework for conducting such an assessment. It should be noted, however, that this framework can also be applied to forecasts developed by the decision makers themselves. Our experience has shown that most people have a propensity toward one of the Five Views of the Future™ described in this paper. (Although there are certainly exceptions, we have found that, in general, engineers tend to be extrapolators; pure scientists tend to be pattern analysts; and marketing people tend to be goal analysts. Executives tend to rate themselves primarily as counter punchers, although, in reality, most are probably primarily intuitors.) Thus, once people determine their natural inclination, they are well advised to emphasize the tests associated with other viewpoints.
It should also be noted that, in applying the tests outlined herein, one not only gains or loses confidence in a given forecast, but one also often discovers information, insights, and concepts beyond those actually addressed in the forecast itself.
If you believe that TFI could be of assistance to your organization in identifying and evaluating new product opportunities and in developing strategies for bringing these products to the marketplace, please contact John Vanston, Larry Vanston, David Smith, or any other member of the TFI consulting staff. (800) 835-3887 or (512) 258-8898
Copyright © 1998, 2000, 2002Technology Futures, Inc. 13740 Research Blvd., Building C, Austin, Texas 78750
All rights reserved. Published January 1998. No part of this white paper may be reproduced in any form or by any means, other than short quotes to be used in reviews, without express permission from the publisher.