
For years, the dreamers and would-be builders of broadband, interactive networks have been searching for the "killer app," i.e., a broadband-based application that would have wide appeal and be important enough for a significant number of customers to buy. The nightmare in this search was the fear of building a network, but being unable to find a killer app that would fill that network with revenue generating traffic. Our fears, however, are being realized in reverse. We have found and implemented the killer app (whether it will generate revenue still seems open to question), without building the network to support it. This app is now turning into a real killer, as it is poised to do serious damage to the existing network.
The emphasis for building a nationwide, broadband network began to gain momentum in the mid-1980s. It became evident in that period that the technology to support such a network was either available, or would be shortly. It was, however, hard to put together a stable business plan without a clear idea of what the prime service (i.e., the killer app) would be. Businessmen kept asking, "Why build it?" In other words, they wanted to know how to evaluate the economics of a network proposal, when there was no projection as to the incremental revenue that the network would produce. In order to make such a projection, there was a need for a "killer app" or, better still, a vision of the direction and services of the network.
Many initially thought the killer app was going to be video on demand (VOD) or something very similar. Therefore, many of the early broadband network field trials (e.g., Cerritos, California and Orlando, Florida) were based on the idea that the killer app would, indeed, be VOD. While these trials appeared to be technical successes, the market results were less clear. To make matters murkier, the owners of these field trials tended to hold closely to the market data resulting from them. Even without public knowledge of this data, it was obvious that the enthusiasm for the broadband networks of the mid-1980s had slowed down considerably by the early 1990s. At about the same time as this lessening of enthusiasm was becoming obvious, a competitor for VOD became seriously viable -- the video store. Video stores lowered their rental charges, and a trip to the video store turned into a social function. From all of these impacts, it became apparent that network-delivered VOD, at least as originally envisioned, was not going to be the killer app.
Because of these complications, and also because of uncertainty as to the appropriate technology (it is very hard to select a technology without really knowing the system requirements), there came a general slowing down of the move toward implementing broadband networks. Many announced projects were cancelled. Where projects were continued, very conservative build-out approaches were taken, instead of following the earlier ideas of converting the entire country.
While the movement toward a public interactive, broadband network was stagnating, home computers were getting cheaper and more powerful, and readily-available modems also got cheaper and faster. In addition, the Internet introduced a graphical and easy-to-use interface called the World Wide Web. As it grew, the Web became a social event, and the inverse of the situation with the video store came about. All of these circumstances added, perhaps non-linearly, to the enticement of "surfing the Net." It turns out that, in a sense, the killer app is interactive VOD, only we call it the World Wide Web, and it runs very slowly in order to utilize existing network capabilities.
While there are many estimates available of Web and Internet growth (and they are all very high), it may be more instructive to consider some the things that are happening in this arena, to get a more intuitive feeling of the mechanism for Web growth.
MORE USERS
MORE SESSIONS
LONGER SESSIONS
All of these are currently in progress. All of them support the ability, the methodology, and the motivation for the increasing use of the Web. The size of the Web and the holding times on Web accesses are also continuing to grow, perhaps even more than in the past.
Nobody knows the future; so no one can say for sure about the future growth of anything. However, if there ever was a case for the continuing growth of any service, maybe even at an accelerated pace, that case is easy to make for Web growth. The bottom line on the growth is summarized in the following three characterizations:
More users
More sessions = Sustained Growth Rate
Longer sessions
This article will first evaluate the impacts of a 60% growth rate (the most common estimate) and will also evaluate the lower rate of 20% in order to give a range of possible impacts.
To resolve this series of contradictions, let's examine today's telephone network and how the Internet interrelates to it. Then, we are going to examine the impact of the projected Internet traffic on this network.
THE TELEPHONE NETWORK -- THE POTENTIAL "VICTIM"
Figure 1 illustrates the existing public telephone network in a highly-simplified manner. The network is built as a series of concentration points. The sizing of these concentration points is based on "traffic engineering." This approach recognizes that it would be impractical to try to provide for unlimited connectivity among all end points (terminals, telephones). Therefore, it provides for a limited connection capability that will result in some small (and acceptable) percentage of lost (blocked) calls.
These concentration points occur at the remote terminal, at the central office, and in the cloud that represents all of the other switching points and facilities of the network. In addition, when the connection is carried on to an Internet service provider, then a new concentration point occurs at the computer serving the Internet provider's customers. A point should be made that these are almost exclusively (up to the interface with the ISP) circuit switched devices. That terminology means that each path is dedicated to an individual call for its duration. If all the circuits in a given path are busy, then calls are blocked (the caller receives a fast busy signal).16
THE INTERNET NETWORK -- THE ACCOMPLICE
In Figure 2, the Internet is depicted as a series of Internet providers -- computers interconnected via a backbone network. The Internet providers are also connected to the public network. Virtually all customers access the Internet through the public network, and Internet providers are then accessed through the "back" (from the end-customer's point of view) of the network. This is a very simplified approach to describing the Internet, but for our purposes, it will suffice.
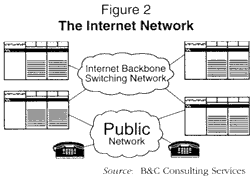
The point is that there is another series of concentration points in the Internet itself. These points, however, are different from the telephone network (Figure 1) in that they are packet switches, rather than the circuit switched arrangement previously described. While traffic overloads in this network certainly will occur, they tend to slow down rather than stop (block) connections. If there is an overload in the Internet portion of these combined networks, then the processing slows down and we get our stock quotes very slowly, for example. If, on the other hand, the public network is overloaded, calls are blocked, and we get a fast busy when we try to dial our Internet provider (or, in the worst case, we can't dial at all, because we never get a dialtone). Unfortunately, in the case of the public network, it is not just us "nerds" who can't get a dialtone -- it is everyone.17
It should first be noted that the entire network is not built using RTs (remote terminals) as illustrated here. The older approach was to run individual paths (cable pairs) directly from the CO (central office) to each telephone. In the 1980s, telcos (led by the Bells but followed by virtually all the telcos) began introducing remote switches (remote terminals -- RTs) as intermediate points in the local exchange network. At first, these RTs were fed by "t-lines" (copper pairs with repeaters operating as digital lines at 1.54 megabits per second providing 24 equivalent voice paths -- known as the DS-1 level of digital multiplexing), but now are almost universally fed by fiber optics. These RTs reduced the investment needed to keep up with new growth and offered the possibility of extending fiber into the exchange distribution plant. Now, the RT-based design is the standard approach for meeting new growth requirements with the exception of growth very close to COs.
We have developed a scenario that looks at the trunking required from the RT to the central office, currently and as Inter-net traffic continues to grow over the next few years (see Sidebar: Remote Terminal Impact Calculations).
| Table 1 Growth of Remote Terminal Trunking Required for Internet Traffic | ||||
|---|---|---|---|---|
| Year | Voice Traffic* | Internet Traffic* | Trunks Needed | DS-1s Needed |
| 1996 | 1,840 | 648 | 77 | 4 |
| 1997 | 1,840 | 1037 | 95 | 4 |
| 1998 | 1,840 | 1659 | 118 | 5 |
| 1999 | 1,840 | 2654 | 158 | 7 |
| *CCS (Centum Call Seconds) | ||||
| Source: B&C Consulting Services | ||||
Table 1 shows the results of the Internet traffic modeled in the scenario. In the last column ("DS-1s Needed"), the number of DS-1 lines needed for trunking between the CO and the RT will increase substantially over the next three years, even though the number of lines served remains constant. Two observations indicate the real impact of this Internet traffic increase.
First, and most obvious, note that the current situation appears to be all right, i.e., the number of DS-1s needed -- four -- will handle the voice traffic plus the Internet traffic. However, if growth continues as the consensus projections indicate, in only a couple of years, the telcos will need to be making yearly additions to their RT trunking (with no revenue increase), and the additions are going to be greater every year. These additions are not so important individually (an added DS-1 costs the telco only about $1,000), but, in aggregate, this could be a great deal of investment. If one-fourth of the nation's 164,000,000 access lines18 is derived via RTs (which is a reasonable and conservative estimate based on the author's experience), then the required investment would be approximately one-fourth of a billion dollars in the above-illustrated three-year period.
The second observation to be made from Table 1 is that data traffic will become a greater volume than voice traffic (compare columns two and three) in the next two to three years. Internet traffic (2,654 ccs) exceeds voice traffic (1,840 ccs) in 1999. This means that the national telecom network will become a data network that just happens to be carrying voice instead of the other way around. Telecom people have been talking about this happening for the last 25 years, but it has never even come close to reality until now. Unfortunately, while there has been a lot of talk about the coming importance of data, there has been very little real planning as to how this data traffic (traffic with some very different characteristics from voice traffic) could be handled.
THE CENTRAL OFFICE -- A REAL DANGER POINT
In looking at the impact of this data traffic on the rest of the public telecom network, it is a little harder to be as specific as in the above analysis. Each part of the network, however, will be impacted -- and substantially. We shall try to overcome the problems of specificity in considering the rest of the network as a universe by looking at another very important entity in that network -- the central office. In this manner, we shall get a better overall picture of the extent of the impacts of this traffic on the network.
The central office -- the "class 5 office" -- is the primary switching point in the national network. In most cases (at this point in time, almost all cases), the access lines for the Internet are the normal telephone lines that everybody buys. These are terminated in the central offices on "line cards" that are parts of "line frames." These frames are interconnected to other line frames and other central offices via trunks. These trunks are paths between switching stages and between COs to allow connectivity to all desired end points. The line cards and the line frames are designed to limit how much total traffic can be handled at any given time. While these limitations tend to be higher than the design amounts for a residential line (used in the remote terminal discussion above), the limits are very real.
To evaluate the central office impact, we will follow the general procedures of the analysis of Internet traffic on remote terminals. We will concern ourselves primarily with the access side (i.e., the end customer side) of the central office switch impact. We select this emphasis not because this will be the first or greatest impact, but rather this will be the result that will have the most universal effect on all subscribers. The impact on the "back side" of the switch (toward the ISPs) will be very great in the line groups connected to the same frames as the ISPs. However, these adversities can be easily localized by the telcos, and the negatives can be limited to those of us accessing the Internet. The impact that we are focusing on will have a direct negative effect on the entire central office complex and, by direct extension, on the entire telephone network (see sidebar: Central Office Impact Calculations).
| Table 2: Internet Traffic Impact on Line Capacity-Central Offices | ||||||
|---|---|---|---|---|---|---|
| Year | Voice Traffic* | Internet Traffic* | Total Traffic | Traffic Capacity** | Lines Capacity*** | % Reduction**** |
| 1996 | 52,000 | 16,848 | 68,848 | 69,332 | 17,333 | - |
| 1997 | 52,000 | 26,956 | 78,956 | 69,332 | 14,733 | 15 % |
| 1998 | 52,000 | 43,129 | 95,129 | 69,332 | 11,959 | 37 % |
| 1999 | 52,000 | 69,006 | 121,006 | 69,332 | 9,359 | 46 % |
| * CCS ** 17,333 lines x 4.0 ccs *** Base case, 1996, is 75% fill **** From previous year |
||||||
| Source: B&C Consulitng Services | ||||||
Table 2 represents the results of evaluating this traffic on the central offices today and in the next few years. Even understanding that there are many assumptions behind the calculations, this table represents a very important result in terms of degrading the capacities of the central offices. The last column -- % Reduction -- shows how much will be lost in the installed central office capacities (while retaining the existing quality of service). The bottom line is, if Internet traffic continues to grow at current rates, i.e., at 60%, then we are going to face a very serious reduction (about 50%) in our central office capacity.
This reduction would require an investment of approximately $25 billion to replace that capacity.19 Even in the stratospheric investment environment of the major telcos, that is a lot of money. Perhaps even more important, there is very little obvious revenue attached to this huge investment, and no indication that the telcos are moving to make this investment. This lack of activity suggests that the central office is going to be the first serious victim of the Internet. This result implies that we are going to see very substantial reductions in the quality (i.e., many more blocked calls) of our overall telephone service in the next few years.
Revise the tariffs -- There is little doubt that a usage-based tariff at some level would reduce the load on the access networks.20 The question remains "Is this a realistic solution from a political and policy point of view?" The answer must be -- "No, this is not acceptable; we want to broaden access to information, not limit it."21
Upgrade the traffic capacity of public networks -- While this has a lot of attraction, the issue of paying for the upgrades must be addressed. How would the LECs ever be paid for this enormous upgrade? Without making substantial changes in the tariffs to pay for the upgrades, there is very little likelihood of this ever being a serious consideration.
Use the remote terminals to deflect the traffic -- This has the potential to be fairly effective. One vendor has recently offered a remote terminal that will do exactly this.22 Their terminal recognizes a call to an ISP and takes it off the network to a true data network (a packet network like the Internet itself). This approach would certainly resolve many of the problems identified in this paper. It would still leave the traffic on the remote terminal itself, but it could be designed to handle a very high incoming traffic load. The problems with this approach are:
Increase Internet network trunking -- This has the potential for helping some, particularly in cases where the problem is a slowdown in processing (caused by the Internet itself, rather than its accesses). However, it would have no impact (except perhaps the negative impact of making the Web work better, therefore attracting more usage) on the real killer in the access networks.23
IP switching -- This is just a special case of the above discussed "increase Internet trunking." It consists of introducing IP-based switches in the Internet network itself. It will have no impact on the fundamental problem of access traffic.24
Broadband -- Here, we are addressing the simple approach of increasing the available bandwidth to the home, e.g., by a hybrid fiber/coax architecture. Yes, this may help some, in that it would allow data to come down the network (and up, for that matter) much faster. However, would it really help the long holding times? There has to be a real question as to its impact. If the tariffs were still the same, would the fact that data comes fast enough to have real motion significantly cut the holding times? My feeling is that it would not. There is no real research on this issue, but I think we would have to severely question the proposition that making the Web work much better (by making it faster) would cut down on usage. I think that as good an argument could be made for exactly the opposite.25
Take the load off the public network -- This will be a very unpalatable answer as far as the LECs are concerned, but it is really just about the only answer. This would require the development of a separate network to the home. While, in some ways, this may sound as expensive as the upgrade of the network discussed above, it should be noted that there are many players today that want to do exactly this. Let us look a little more closely at this solution.
A SOLUTION TO THIS CRIME
A long-term solution is to take the traffic off the public network. That network was never designed to carry this amount of data traffic, and we are in a unique situation to be able to actually achieve this solution. This uniqueness results from the Telecommunications Act of 1996. Because of it, local loop competition is now being encouraged, and there are many companies offering a variety of technologies that are anxious to compete in this arena. This situation offers the possibility that some of these companies will compete with offerings that, in fact, anticipate handling Internet data traffic. It should be noted that non-facilities-based competitors add nothing to this solution, since they are merely reselling the facilities of the LECs and doing nothing to provide a different path for this traffic.

Figure 3 illustrates the solution of having multiple providers delivering services to the home. One attractive feature of this solution is that it need not be implemented universally to have far-reaching impacts. The geographic locations most desirable to competitors obviously are those demographic pockets where there is the greatest source of Internet and other kinds of traffic. As these pockets begin to be served by multiple providers, the entire network will benefit by a reduction in data traffic.
With this scheme, there are many facility-based local service providers available to the home. Some of these could well be prime servers of data services such as Internet access. The residential gateway has been discussed in recent articles by this author and others. In this arrangement, the home user can access various networks for different services without having to solve the connection selection and configuration problems every time. This could well be the enabling technology to achieving this "multiple provider" fix of the Internet traffic problem.
This scheme not only solves the problem of the excessive traffic buildup on the public network, but it starts us toward a much more useful set of Internet features -- and with this solution we are no longer concerned about encouraging greater usage.
The real question is, "Where will the leadership come from to start this solution moving?" There is a clear danger to a very vital national resource -- the public telephone network. In order to address this problem, we need leadership that is willing to make the difficult decisions necessary to move forward with this solution. Some part of the solution will offend almost every vested interest, but no other solution is apparent. Hopefully, this leadership can be found in industry and government before the network becomes severely damaged.
In order to prevent this disaster from occurring, we need:
Let us now see what affect the presently-known level of Internet usage would do to this link. As we have seen, many current estimates are that 8% of the population is using the Internet and that their average holding time (time spent on line) is between 20 and 33 minutes. If we take the midpoint of these holding time estimates as 27 minutes, then that is 16.20 ccs (27 x 60 / 100) for 40 of the lines (8% of 500) or 648 ccs total of Internet traffic. The remaining 460 lines would still be operating at 4 ccs per line or 1,840 ccs of voice traffic for a total traffic of 2,488 ccs. The 96 trunks provided could handle 2,615 ccs, so there is no problem-or is there?
In this typical scenario, there is plenty of capacity to handle the Intranet traffic of today, but a more disturbing point should be made. This example (which was selected to be typical) happens to fall at a trunk break point. If the maximum for the RT had been targeted at 450 lines, then only three DS-1s would have been provided. Then, the math would have shown a slight degradation on the service of the RT due to Internet traffic -- meaning that more than the design objective of five in 1,000 calls would have been blocked. In this slight change of the scenario, we would be experiencing traffic difficulties today rather than in future years. The disturbing fact is that this is already the case in some locations today (see the reference in footnote 3 for a discussion of COs that are already in trouble).
The selected vendor's traffic data indicates that a change of 1.22 BH ccs (43.8%) per line will reduce the line capacity of their frames by 33.9%. In going to a change of 124% (increase of 3.47 BH ccs per line), the line capacity is reduced by 55%. This is obviously not a linear relationship. In fact, it is very non-linear. (If it were not, high traffic increases would result in negative line capacities.) We are now going to use this information to make estimates as to the impact of Internet traffic increases on our installed base of central offices.
To do this, we will consider the average RBOC central office of 13,000 lines in service (in 1996) and 17,333 lines equipped (estimating an average of a 75% fill ratio). We will assume that it is nominally capable of handling 4.0 BH ccs per average line equipped. Then, we will follow the methodology of our previous analysis of the remote terminal by projecting the Internet traffic increase each year and the resulting total traffic in the office. We will use this result to estimate the reduction in line capacity of the central office due to the Internet traffic to maintain the same quality of service (.5 lost calls in a 1,000) for the office. This reduction in capacity will be used to estimate the capital cost of adding to for the office to maintain the same line serving capability.